|
by
kirupa | 14 December 2008
In the
previous page, you got a brief intro to easing
and started to look at a simple animation that you
can add easing to. In this page, you'll learn how to
add easing and more about what easing means in
Silverlight and WPF.
Modifying your
KeySpline curve is fairly straightforward. You have
two ways of changing the type of easing applied. One
way is by numerically changing the x1, x2, y1, and
y2 fields
[ you can modify your curve directly by entering
numerical values ]
The more common way is
by manipulating the KeySpline curve directly using
the yellow circles on each end:
[ you can directly manipulate the curve by using the
circles ]
You can drag these
circles around to see how they would affect your
KeySpline curve:
[ this is a crazy easing curve ]
As you alter the
curve, notice that the x1, x2, y1, and y2 values
adjust accordingly. Likewise, if you alter the x1,
x2, y1, and y2 values, your curve is adjusted
automatically as well.
Make sure you still
have
the keyframe on time 1 selected, and modify your
KeySpline curve to look like the following:
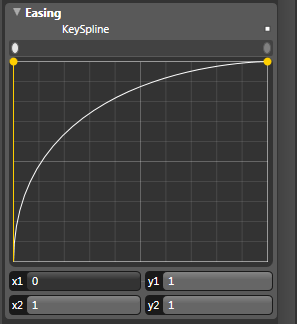
[ this curve represents a smooth deceleration ]
Once you have done
this, select the keyframe at time 2. This time
around, modify the KeySpline curve to look like the
following:
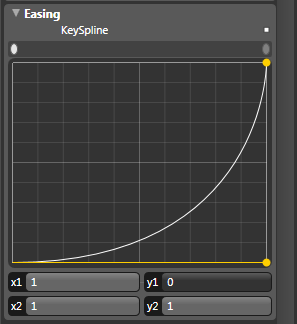
[ this curve represents a smooth acceleration ]
After you have done
this, press F5 to see what your animation looks
like. Notice that the image of the Expression Blend
box does what you wanted it to do. It speeds in to
the center, slows down a bit, and then just zooms
out to the right. All of this was done by just
altering the shape of the easing / KeySpline curves.
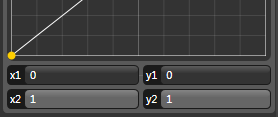
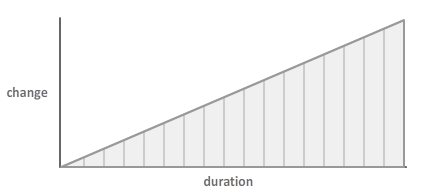
On the first page, I showed you two examples of
easing curves. The first curve was perfectly linear
indicating a constant change in the properties:
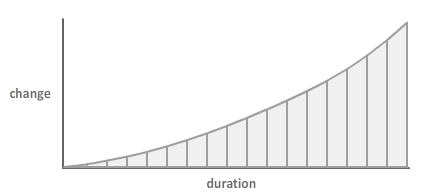
The second curve
indicated an acceleration was in progress:
How was I able to read
that? The trick lies in in figuring out what
actually gets animated. In Silverlight and WPF, all
animations are
property-animations. In a nutshell, that means
the values representing the properties of your
object change over a period of time to create an
animation. These
properties could be as varied as the position of
your element, the fill color, to basically anything
that defines what you are animating.
For a simple sliding
animation where an element moves from one side of
the screen to another, a property representing the X
position gets altered. You can verify the exact
property by expanding the animated node in the
Objects and Timeline panel until you can expand no
more.
In our example,
as I expand the image element, the following is what
I see:
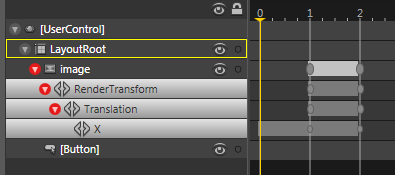
[ expanding the element reveals the properties that
are being affected ]
Drilling down the tree
from image, the X property on
Translation is what is getting altered at each time
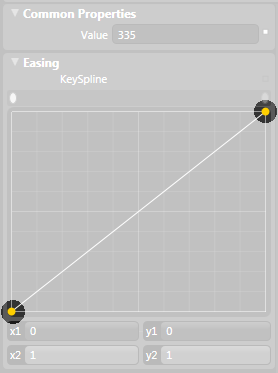
tick. At the 1 second mark, when I click on the
keyframe, the value is 355:
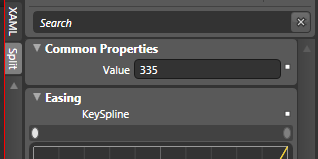
[ the X property's value at time 1 ]
At the two second
mark, the value is 670:
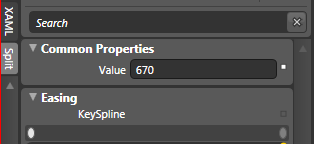
[ the X property's value at time 2 ]
This means that
between keyframes 1 and 2, the value of the X
property changed from 355 to 670. How these values
changed in that 1 second is what your KeySpline
curve represents.
What the KeySpline
curve affects is the change in properties leading
into a keyframe. The KeySpline
curve on KeyFrame 1 affects the animation between
times 0 and 1, and the KeySpline curve on KeyFrame 2
affects the animation between times 1 and 2.
To use
our example, the easing curve you see on KeyFrame 1
represents how the X property changes between time 0
and time 1:
[ the easing curve for the first keyframe ]
Reading the chart, you
can see that the property change accelerates at the
beginning and gradually decelerates as you approach
the end. This maps with exactly what you see when
you run the animation where the image is speeding in
and slowing down as you approach the half-way point.
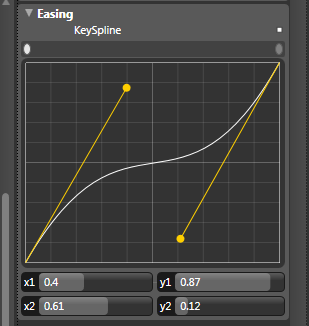
Let's
look at the second KeySpline curve you see at Time
2:
[ the easing curve for the second keyframe ]
In this, you can see
by the curve that we start off slow and then
suddenly speed up. This is the same as your image
increasingly getting faster as it disappears to the
right.
Putting it all
together, you have the animation that you had wanted
to create all along!
Just a final word before we wrap up. What you've seen here is freshly baked content without added preservatives, artificial intelligence, ads, and algorithm-driven doodads. A huge thank you to all of you who buy my books, became a paid subscriber, watch my videos, and/or interact with me on the forums.
Your support keeps this site going! 😇

|